Returns
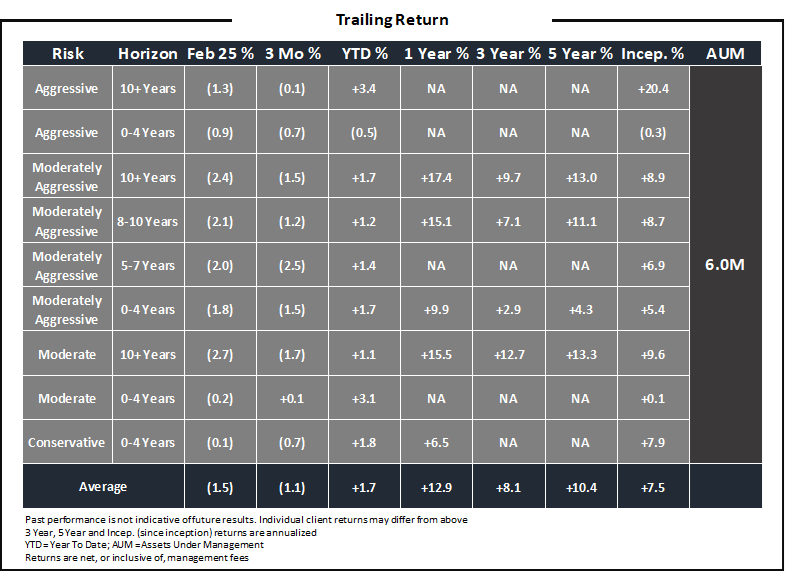
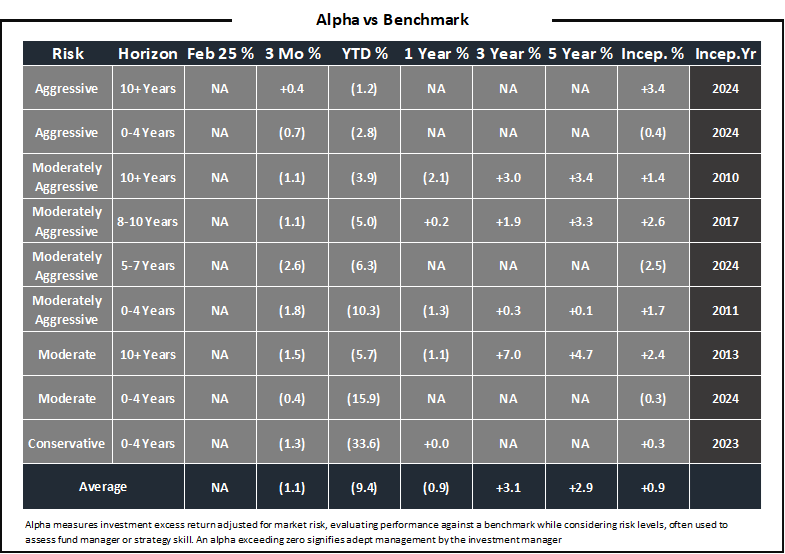
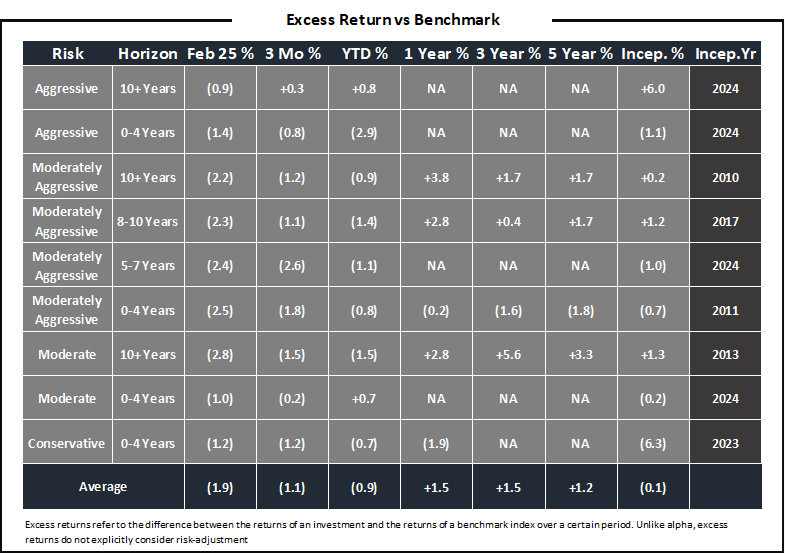
Here’s an overview of our recent performance, showcasing returns for the prior month, 3-month trailing period, year-to-date, 1-year trailing, 3-year trailing, 5-year trailing, and since inception. All returns are net of fees, reflecting our dedication to transparency and accountability. We also present trailing Alpha and trailing excess returns versus investment benchmarks below.
Alpha represents the excess return of an investment relative to the return of a benchmark index, highlighting our ability to generate returns beyond standard market movements. This metric is particularly useful as it demonstrates our skill in achieving superior performance.
Each figure reflects our commitment to your financial success. As you explore our trailing returns, remember that your goals drive our decisions.
Let’s uncover the story behind these numbers and navigate a path to prosperity together. Your investments are our priority, and we’re excited to share this journey with you. Thank you for choosing Diversified Consumer Planning LLC. Your success is our shared achievement.


